|
HOW ARE SPECIES DISTRIBUTIONS PREDICTED TO SHIFT UNDER ALTERNATIVE CLIMATE CHANGE SENARIOS?
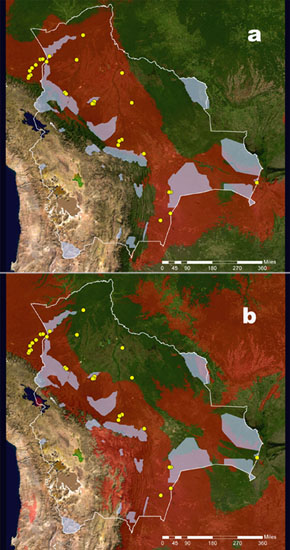
Image (a) depicts the actual predictive distribution for Tapirus terrestris. The distribution was produced using MaxEnt freeware and the localities were obtained from GBIF and the Rapid Assessment Program. The red area represents the zone where there is a probability of 10% and above of finding the right conditions for the occurrence of the species. The grey area represents the actual coverage of the Bolivian National System of protected areas. Image (b) represents the predicted future distribution of the species in a Climate Change Scenario of 5 degrees more in the monthly temperature. This prediction does not take in account the effects of the change in temperature over the precipitation. |
 |
why map biodiversity? |
 |
|